Travel Demand Model FAQ's

What is a Travel Demand Model?

The Travel Demand Model (TDM) is an essential tool which helps determine the county's future transportation need. A TDM:

  • Forecasts vehicular trips onto transportation facilities, roadways, highways, etc.
  • Is a tool used by most public agencies (cities, counties, Caltrans, SACOG)
  • Determines roadway needs for the future as part of the planning process

The model uses statistical equations and key inputs to estimate how much traffic will be on our County roadways in the future. The key inputs include roadway characteristics (such as the speed limit, number of lanes, and classification) and land use characteristics (such as the number of households that exist today and in the future).

Does the TDM calculate Level of Service (LOS)?

No. The TDM only generates the traffic levels for roadways and intersections. LOS calculations are conducted using different software, independent of the TDM.

Can I use the TDM?

The TDM is not available for use by the general public. The TDM requires a software license for CUBE, published by Bentley (formerly Citilabs). Typically, transportation planners and engineers are the operators of the TDM and use it in support of transportation impact studies, fee programs, planning documents and other uses. The County does make the TDM available for use by consultants and other public agencies for specific projects. Please contact Zach Oates at zach.oates@edcgov.us to request the TDM files.

What is Level of Service?

Level of Service (LOS) is a general measure of traffic operating conditions on a particular roadway where a letter, from A (best) to F (over capacity), is assigned. LOS can refer to the speed, convenience, comfort and security of transportation facilities as experienced by users.

The following definitions and data provided in Table 1 below are from the Highway Capacity Manual 7th Edition, (HCM), Transportation Research Board, 2022.

Table 1

Term Definition
Capacity The maximum sustainable hourly flow rate at which persons or vehicles reasonably can be expected to traverse a point or a uniform section of a lane or roadway during a given time period under prevailing roadway, environmental, traffic, and control conditions.
Class I two-lane highway Highway where motorists expect to travel at relatively high speeds, such as major intercity routes, primary connectors of major traffic generators, daily commuter routes, or major links in state or national highway networks.
Class II two-lane highway Highways where motorists do not necessarily expect to travel at high speeds, such as access routes to Class I facilities, scenic or recreational routes, or routes passing through rugged terrain.
Class III two-lane highway Highways serving moderately developed areas, such as portions of a Class I or Class II highway that pass through small towns or developed recreational areas.
Cycle A complete sequence of signal indications.
Cycle Length The total time for a signal to complete one cycle; or, for a work zone involving alternating one-way operation, the average time taken to serve each direction of travel at once.
Delay Additional travel time experienced by a driver, passenger, bicyclist, or pedestrian beyond that required to travel at the desired speed.
Density The number of vehicles occupying a given length of a lane or roadway at a particular instant.
Design-level analysis An application of the HCM to establish the detailed physical features that will allow a new or modified facility to operate at a desired LOS or performance value. Inputs are based substantially on proposed design attributes; however, the intermediate- to long-term focus of the analysis will require use of some default values.
Follower A vehicle following its leader at a headway of 2.5 seconds or less.
Free-flow speed (FFS) The theoretical speed when the density and flow rate on a study segment are both zero; or the average speed of vehicles on a given segment, measured under low-volume conditions, when drivers are free to drive at their desired speed and are not constrained by the presence of other vehicles or downstream traffic control devices.
Freeway A fully access-controlled, divided highway with a minimum of two lanes (and frequently more) in each direction.
Highway A general term for denoting a public way for purposes of vehicular travel, including the entire area within the right-of-way.
Multi-lane highway A highway with at least two lanes for the exclusive use of traffic in each direction, with no control or partial control of access, but that may have periodic interruptions to flow at signalized intersections no closer than 2 miles.
Operations-level analysis An application of an HCM methodology under which the user supplies detailed inputs to HCM procedures, with no or minimal use of default values.
Percent followers The percentave of vehicles passing a given point on the roadway that are considered to be in a follower state.
Planning-level analysis An application of the HCM generally directed toward broad issues such as initial problem identification, long range analyses, and regional and statewide performance monitoring. Nearly all inputs to the analysis may be defaulted.
Platoon A group of vehicles or pedestrians traveling together as a group, either voluntarily or involuntarily because of signal control, geometrics, or other factors.
Progression The act of various controllers providing specific green indications in accordance with a time schedule to permit continuous operation of groups of vehicles along the street at a planned speed.
Queue A line of vehicles, bicycles, or persons waiting to be served due to traffic control, a bottleneck, or other reasons.
Queue Length The distance between the upstream and downstream ends of the queue.

What is LOS for a Two-lane Highway?

LOS A: Motorists experience high operating speeds on Class I highways, and little difficulty in passing. Platoons of three or more vehicles are rare. On Class II highways, speed would be controlled primarily by roadway conditions, with a small amount of platooning expected. On Class III highways, drivers should be able to maintain operating speeds close or equal to the free-flow speed (FFS) of the facility.

LOS B: Passing demand and passing capacity are balanced. On both Class I and II highways, the degree of platooning becomes noticeable. Some speed reductions are present on Class I highways. On Class III highways, it becomes difficult to maintain FFS operations, but the speed reduction is still relatively small.

LOS C: Most vehicles are traveling in platoons. Speeds are noticeably curtailed on all three classes of highway.

LOS D: Platooning increases significantly. Passing demand is high on both Class I and Class II facilities, but the ability to pass approaches zero. A high percentage of vehicles are now traveling in platoons, with a noticeable percent time spent following (PTSF). On Class III highways, the reduction from free-flow speed is significant.

LOS E: Demand is approaching capacity. Passing on Class I and Class II facilities are virtually impossible. Speeds are curtailed, and the percent time spent following (PTSF) is more than 80%. On Class III highways, speed is less than two-thirds the FFS. The lower limit of this LOS represents capacity.

LOS F: Exists whenever demand flow in one or both directions exceeds the capacity of the segment. Operating conditions are unstable, and heavy congestion exists on all classes of two-lane highways.

What is LOS for a Multi-lane Highway?

LOS for a Multi-lane highway addresses capacity and LOS for uninterrupted-flow segments, and is defined on the basis of density, which is a measure of the proximity of vehicles to each other in the traffic stream. LOS A through D criteria is the same as that for basic freeway segments. LOS E and F have their own criteria for a multi-lane highway as defined below.

LOS A: Free-flow operations. Vehicles are almost completely unimpeded in their ability to maneuver within the traffic stream. The effects of incidents or point breakdowns are easily absorbed.

LOS B: Reasonably free-flow operations. The ability to maneuver within the traffic stream is only slightly restricted, and the general level of physical and psychological comfort provided to drivers is still high. The effects of minor incidents and point breakdowns are still easily absorbed.

LOS C: Provides for flow with speeds near free-flow levels. Freedom to maneuver within the traffic stream is noticeably restricted, and lane changes require more care and vigilance on the part of the driver. Minor incidents may still be absorbed; queues may be expected to form behind any significant blockages.

LOS D: Speeds begin to decline with increasing flows, with density increasing more quickly. Freedom to maneuver with the traffic stream is seriously limited and drivers experience reduced physical and psychological comfort levels. Even minor incidents can be expected to create queuing, because the traffic stream has little space to absorb disruptions.

LOS E: The lower level represents capacity. There are few usable gaps within the traffic stream to accommodate maneuvers. Minor incidents create queuing and breakdowns.

LOS F: Demand flow exceeds capacity.
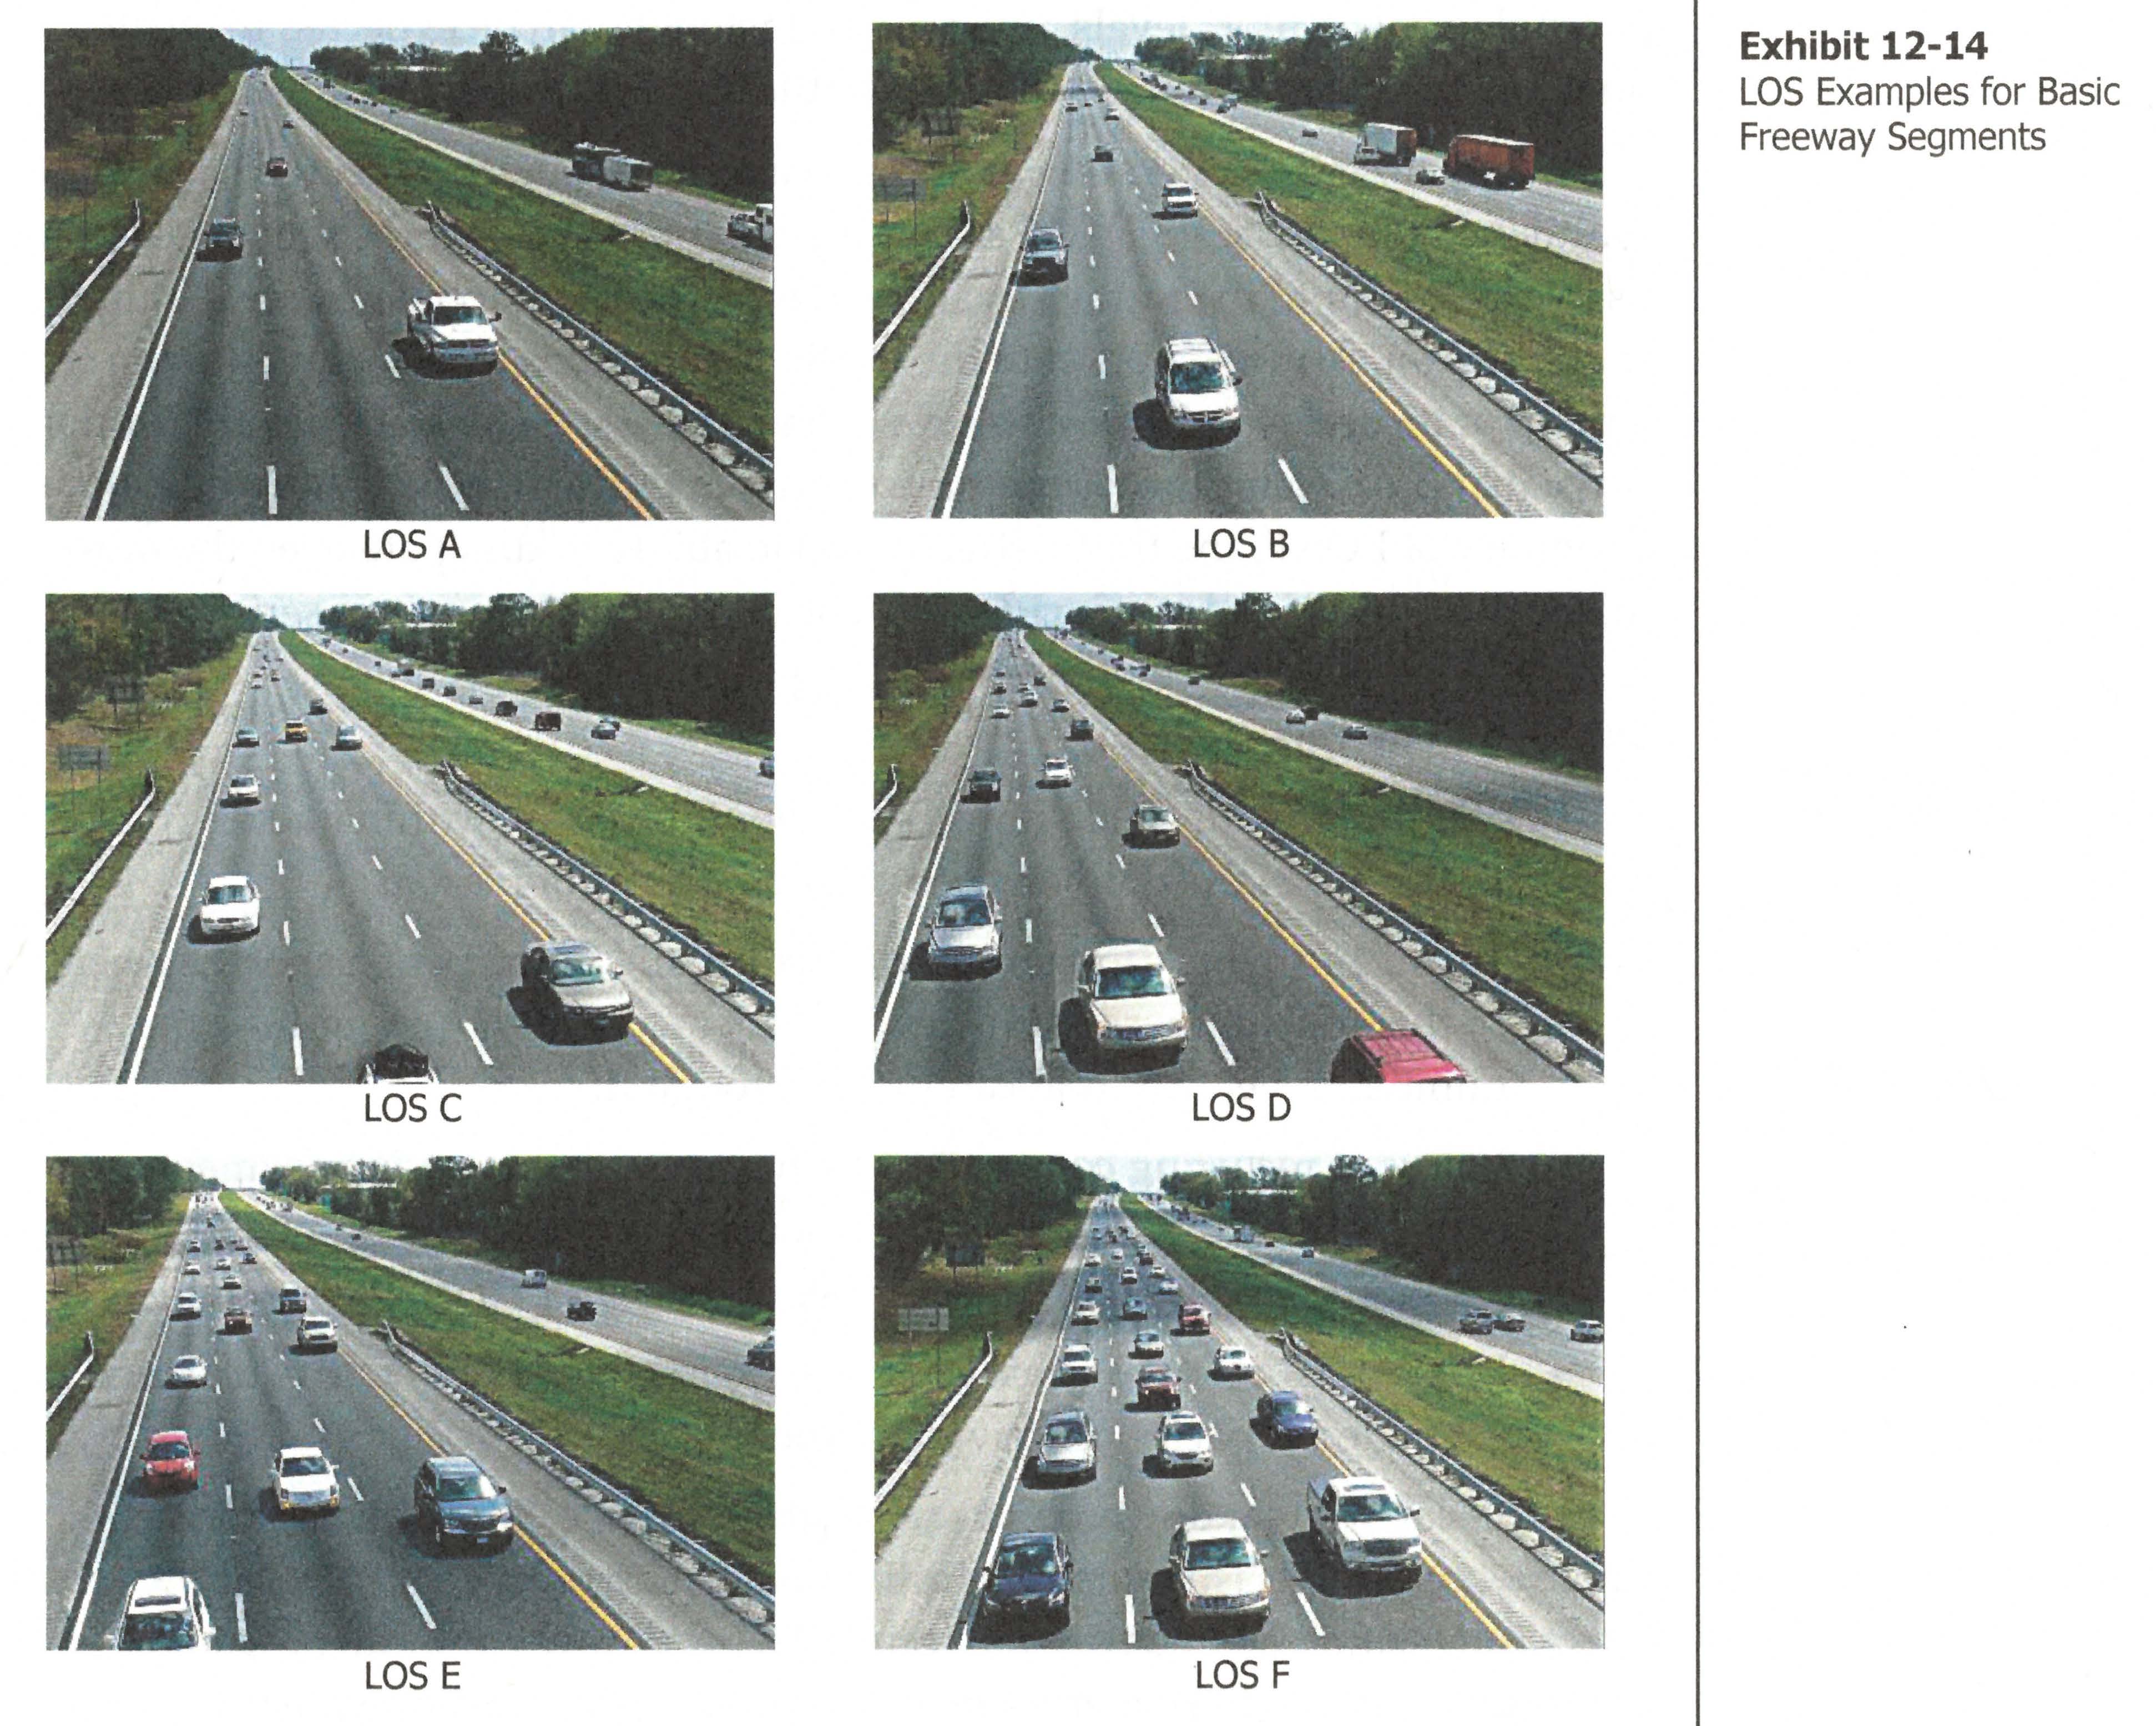
LOS Examples for Basic Freeway Segments
Figure 1: LOS Examples for Freeway Basic Segments
(Highway Capacity Manual 7th Edition, Chapter 12, page 12-17)

What is LOS for Signalized Intersections?

LOS A: This level is typically assigned when the volume-to-capacity ratio is low and either the progression is exceptionally favorable or the cycle length is very short. If it is due to favorable progression, most vehicles arrive during the green indication and travel through the intersection without stopping.

LOS B: This level is typically assigned when the volume-to-capacity ratio is low and either the progression is highly favorable or the cycle length is very short. More vehicles stop than with LOS A.

LOS C: This level is typically assigned when progression is favorable or the cycle length is moderate. Individual cycle failures (i.e., one or more queued vehicles are not able to depart as a result of insufficient capacity during the cycle) may begin to appear at this level. The number of vehicles stopping is significant, although many vehicles still pass through the intersection without stopping.

LOS D: This level is typically assigned when the volume-to-capacity ratio is high and either progression is ineffective or the cycle length is long. Many vehicles stop and individual cycle failures are noticeable.

LOS E: This level is typically assigned when the volume-to-capacity ratio is high, progression is unfavorable, and the cycle length is long. Individual cycle failures are frequent.

LOS F: This level is typically assigned when the volume-to-capacity ratio is very high, progression is very poor, and the cycle length is long. Most cycles fail to clear the queue.

The following videos illustrate Levels of Service A through F at a signalized intersection. Video simulations were produced by Dave Stanek, Associate at Fehr and Peers:

What is LOS for Unsignalized Intersections with Stop Control (stop signs)?

LOS for a stop controlled intersection is determined by the computed or measured control delay. The LOS criteria for stop controlled intersections are somewhat different from the criteria used for signalized intersections, primarily because user perceptions differ among transportation facility types. The expectation is that a signalized intersection is designed to carry higher traffic volumes and will present greater delay than an unsignalized intersection. Unsignalized intersections are also associated with more uncertainty for users, as delays are less predictable than they are at signals.

Table 2: LOS Criteria for Intersections

LOS Unsignalized Intersections Average control delay (sec/veh) Signalized Intersections Average control delay (sec/veh)
A < 10 < 10
B > 10 and < 15 > 10 and < 20
C > 15 and < 25 > 20 and < 35
D > 25 and < 35 > 35 and < 55
E > 35 and < 50 > 55 and < 80
F > 50 > 80

Source: "Highway Capacity Manual 7th Edition", Transportation Research Board, 2022, pp. 20-6, 19-16.

Notes: Delay is in seconds per vehicle. For Signalized Intersections – average control delay represents the average of all approaches. For Unsignalized Intersections – average control delay represents the weighted average of all approaches (all-way stop control) or the worst approach (one- or two-way stop control).

Why do I keep hearing that U.S. Highway 50 is at LOS F?

U.S. Highway 50 is a State highway, and the responsibility of Caltrans. Caltrans is responsible for not only providing trans-sierra, intra- and inter-state traffic movement (east and west), but for providing a portion of the City of Placerville’s north/south street movement (Highway 49).

Additional capacity in Placerville has recently been provided by Caltrans. However, as long as the three traffic signals are necessary for safe movements of city traffic, and high volumes of traffic use U.S. Highway 50, congestion within the City of Placerville will occur.

Prior to the ramp metering of the westbound on-ramp at El Dorado Hills Boulevard, which became operational in Spring of 2015, U.S. Highway 50 from the El Dorado Hills Boulevard/Latrobe Road interchange to the County line frequently operated at LOS F in the westbound direction during the AM peak hour (7:20 – 8:20 AM). Caltrans reports all other segments of U.S. Highway 50 operates at LOS E or better. However, the County’s traffic analysis using the TDM differs from Caltrans analysis results provided in the Caltrans 2014 Transportation Concept Report and Corridor System Management Plan for United States Route 50 (see Supporting Documents for the Caltrans report). Also, see the Supporting Documents for a staff memo dated 9-1-2015 to the Planning Commission which contains a discussion and documentation regarding LOS on Highway 50, including an explanation regarding why Caltrans and the County arrive at different conclusions.

I came home from Lake Tahoe last weekend, and it was bumper to bumper traffic through Placerville. Why doesn't the County fix U.S. 50?

The County of El Dorado is required to comply with statutory requirements. The County does not collect Traffic Impact Fees (TIF) that can be applied to upgrade Highway 50 from Placerville to Lake Tahoe, or State Route 193 or State Route 49. The General Plan emphasizes addressing the weekday peak hour, and the analysis does not consider the impacts of traffic resulting from weekend tourism or weekend agricultural uses (e.g., wineries, Apple Hill, skiing, etc.)

Why doesn’t the County lower the speed limits on Green Valley Road?

The County of El Dorado sets the speed limits according to the provisions in the California Vehicle Code (CVC) and the California Manual on Uniform Traffic Control Devices (CA MUTCD). Please see Supporting Documents - AAA Effective Speed Zoning, Why and How booklet for a user-friendly description of the process.

When does El Dorado County collect Traffic Counts?

El Dorado County has been collecting road segment counts since the 1980's. The Community Development Agency, Transportation Division, Special Projects & Materials Testing section has staff that place pneumatic tube counters on the various County roads throughout the year. The County’s task is to collect representative samples of yearly traffic counts. Staff also performs counts at historical times, to compare one year to the next. Traffic counts are not only taken at peak hours, as both highs and lows are needed to get an average representation. In addition, counts are taken to determine the impacts of various activities (e.g., when school is in session vs. school vacations, or Apple Hill in October vs. July).

Traffic count information is available in three formats: Hourly Traffic Count Reports, Annual Traffic Count Summary, and Five Year Traffic Count Summary. Traffic Operations is responsible for the collection and reporting of information. The last ten years of segment counts are posted on the Transportation Division Traffic Counts. Since a number of factors may impact count data collection from year to year (e.g., construction on neighboring roads, holidays, special events, etc.) caution should be exercised when using the data on the website for comparison purposes. The Special Projects & Materials Testing staff can be reached at (530) 642-4989.

El Dorado County does not collect traffic counts for any state highways (i.e. U.S. Highway 50, State Route 49, State Route 193) since Caltrans is responsible for maintaining information on their state highway infrastructure. For the state highway system, the County relies on Caltrans data via the Caltrans Performance Measurement System (PeMS) plus volumes that Caltrans provides. This data is available for public use.

Can the TDM do intersection level analysis?

The TDM is a Macro (planning level) analysis tool, but can provide input for a Micro (design and operational level) analysis. Macro analysis can provide a basic idea of the general condition of an intersection based on the adjoining roadway segments. (See Supporting Documents for an illustration of the Macro vs. Micro processes for traffic analysis.)

To obtain specific results of the operations of an intersection, a separate software program is required. The County has just acquired the software required to run the Micro analysis. The TDM provides the foundational information to run the more specific micro analysis at desired locations.

There are three primary levels of analysis, listed from most to least detailed:

  1. Operational Analysis: Typically focuses on current or near-term conditions, and is the most data-and detail-intensive type of analysis. This level of analysis is required for proposed development projects.
  2. Design Analysis: Typically used to identify the required physical characteristics of a transportation facility that will allow it to operate at a desired LOS.
  3. Planning and Preliminary Engineering Analysis: Typically focuses on future conditions, with broad issues such as initial problem identification, long-range analyses, and performance monitoring.

Does the TDM include proposed General Plan amendment projects (i.e., Marble Valley, etc.)?

The TDM only assumes approved/adopted land uses. The TDM assumes land uses as identified in the 2004 General Plan, which does not include any of the proposed General Plan amendment projects. These proposed projects are discretionary, and would require approval by the Board of Supervisors. Therefore, the County cannot include proposed development projects as part of the analysis for improvements to the roadway network. If any General Plan amendments are adopted, LRP will incorporate them into the model during the next model update.

If you have lower growth forecasts, won’t traffic impact fees be lower? What is the difference between a highway and a freeway?

Not necessarily. When the 20 year growth forecast has been finalized, the County will be able to run existing and future scenarios to evaluate traffic impacts from current and potential future land uses. The traffic impact evaluation of projected growth and where it occurs can then be used to determine the appropriate roadway infrastructure needs throughout the west slope of the County.

The basic calculation for Traffic Impact Fees (TIF) is:
TIF = Revenue Required (Cost of Needed Improvement) / Growth Expected (# of Units)

Here are four hypothetical examples of how changes to growth forecasts and/or infrastructure needs could impact TIF:

  1. If the roadway infrastructure needs do not change significantly as compared to the current requirements, but the number of forecasted residential units increase, there is a possibility that the TIF will decrease.
  2. If the roadway infrastructure needs do not change significantly as compared to the current requirements, but the number of forecasted residential units decrease, there is a possibility that the TIF will increase.
  3. If the number of forecasted residential units does not change significantly, but the roadway infrastructure needs decrease, there is a possibility that the TIF will decrease.
  4. If the number of forecasted residential units does not change significantly, but the roadway infrastructure needs increase, there is a possibility that the TIF will increase.

Has the TDM been calibrated appropriately?

Yes, Kimley-Horn & Associates have documented their assumptions and the criteria used to calibrate and validate the TDM. DKS Associates performed an independent peer review of the TDM and deemed it calibrated and validated appropriately. Caltrans modeling staff and Sacramento Area Council of Governments (SACOG) modeling staff were involved in the process to update the TDM.

Does the model account for growth in Folsom near the County line?

Yes, the model includes a buffer area along the Highway 50 corridor that extends from the Folsom-El Dorado Hills border to the west through the City of Folsom, Rancho Cordova, and unincorporated areas of Sacramento County. This buffer area includes land uses in the aforementioned neighboring jurisdictions to assist with capturing trips either originating or ending outside of El Dorado County boundaries in order to accurately predict trip distributions and assist with fair-share calculations.